Lesson 3
1. Lesson 3
1.6. Explore 4
Module 4: Statistical Reasoning
In Lesson 1 you were presented with data from Mr. Kong’s Block 1 and Block 4 statistics quiz.
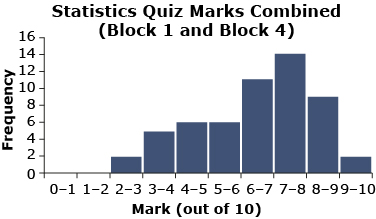
The distribution for the combined quiz marks is skewed to the right. In other words, the data is not symmetrical about the mean. So the data from Mr. Kong’s Block 1 and Block 4 statistics quiz is not normally distributed. Remember that this graph is only for 55 quizzes.

These graphs represent skewed data.
Regardless of whether data is normally distributed and symmetrical about the mean or asymmetrically distributed, it is not possible for all of the data to be above the mean. Some data will always be below the mean and some data will always be above the mean. Therefore, it is not possible for all students in a class to be above average.
Self-Check 3
You can use the “Statistics and Decision Making” applet to review the concepts covered in this lesson. At the LearnAlberta website, you may be required to submit a username and a password. You can obtain these from your teacher. Then choose “Standard Deviation and the Normal Curve.” This will take you to a new page, and you should select “4: Statistics and Decision Making.”
Add the properties of a normal distribution to your notes organizer. You can use the information presented in this lesson. Or you can use the information provided “In Summary” on page 278 of your textbook. You may find information from other sources.