Lesson 3
1. Lesson 3
1.8. Lesson 3 Summary
Module 4: Statistical Reasoning
Lesson 3 Summary
Data that approximates a normal distribution has special characteristics. The graph of data that approximates a normal distribution is symmetrical and bell-shaped. The normal curve’s distinct properties make it a very useful tool for comparing data or making decisions.
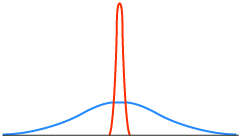
The mean of a normal curve describes the position of the normal distribution on the x-axis, and the standard deviation describes the width of the normal distribution. Here are two normal distributions with the same mean but different standard deviations.
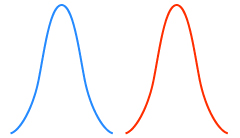
Here are two normal distributions with the same standard deviation but different means.
The spread of the normal curve is controlled by the standard deviation. The larger the standard deviation, the more spread out the data and wider the curve.
The area under the normal curve is equal to 1 since it represents 100% of the data. The majority of the data in a normal distribution is located close to the mean. As you move out to the left or to the right, the area under the curve approaches zero. About 68% of the data is within one standard deviation of the mean, about 95% of the data is within two standard deviations of the mean, and about 99.7% of the data is within three standard deviations of the mean.
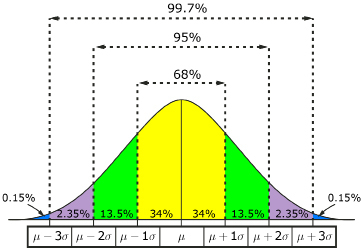
The 68-95-99.7 property of normal distributions is useful for making estimates about data. For example, companies can use a normal curve to estimate what length of warranty to offer on their product.
In Lesson 4 you will investigate how the normal curve can be used to make estimates about data that doesn’t fall at exactly one, two, or three standard deviations away from the mean.