Lesson 2
1. Lesson 2
1.4. Explore
Module 6: Proportional Reasoning
Explore
In Discover you saw how a graph could be used to compare two rates: the speed of two runners. The slopes of the distance-time graphs represented the speeds of the runners.
Recall that the slope of a line can be calculated by determining the rise and run between any two points on a line.
For a distance-time graph, this means dividing the change in distance by the change in time.
![]()
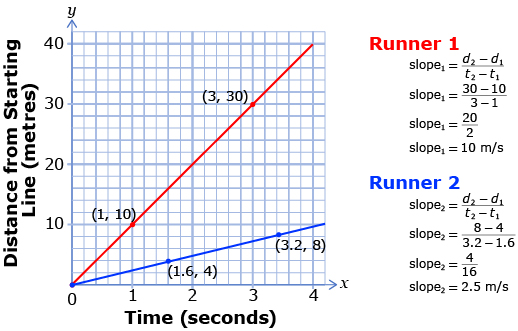
A lot can be learned from examining the graph. First, the slope of the graph for Runner 1 is steeper than Runner 2. That means that Runner 1 had a faster speed. Each of the graphs is linear (i.e., a straight line). This means that the rate is constant. In other words, the runners maintained a constant speed throughout the race.
From the calculations, Runner 1 had an average speed of 10 m/s. Runner 2 had an average speed of 2.5 m/s. Runner 1 was 7.5 m/s faster than Runner 2.
In this example, speed is a rate of change expressed in metres per second (m/s). Since the numerical value of the second term is equal to one (1 second), speed is a unit rate.
Try This 2
Use the “Slope as a Rate of Change” applet to compare the speed of a race car as it runs laps on a track. First, click on “Rise, Run, and Slope.” Then choose “Slope as a Rate of Change.”

Read “Example 2: Connecting the slope of a line segment to a rate” on pages 446 to 448 of your textbook. Note how Gilles uses the slope of each line segment to help him come up with a reasonable scenario.
Self-Check 1
Complete “Check Your Understanding” questions 3, 12, and 13 on pages 450 to 452 of your textbook. Answer