Lesson 2
1. Lesson 2
Module 6: Proportional Reasoning
Lesson 2: Representing Rates with a Graph
Focus

Hemera/Thinkstock
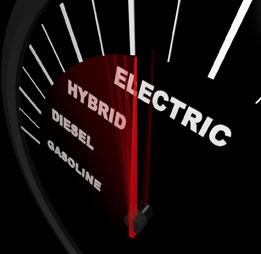
One rate that sparks much debate is the cost of gasoline. It is one rate that some people check daily. As the price of gas and environmental awareness rise, the push for more fuel-efficient vehicles increases.
Scientists, inventors, and manufacturers are looking at various car designs and alternative fuel sources. Hybrids, electronic cars, solar cars, cars that can run on biofuels, and even cars that run on used oil from deep fryers have been developed. Creating more aerodynamic designs and using lighter building materials are two other ways car designers are trying to increase fuel efficiency for vehicles.
Did You Know?
Progressive Insurance held a $10 million dollar Automotive X PRIZE competition where contestants had to create a mass-market car that could get more than 100 mi to the gallon. That’s about 2.35 L per 100 km! Want to check out some of these X CARS, including the eVaro from Maple Ridge, BC? For more information, type “Progressive Automotive X Prize” or “X CARS” into your favourite Internet search engine.
Fuel consumption or fuel efficiency is expressed as a rate (usually in litres per 100 km or miles per gallon). Graphs can be used to represent and compare the fuel efficiency of different vehicles.
This lesson will help you answer the following inquiry questions:
- How can graphs be used to represent and compare rates?
- How can rates be used to solve problems?
Assessment
- Lesson 2 Assignment
All assessment items you encounter need to be placed in your course folder.
Save a copy of the Lesson 2 Assignment to your course folder. You will receive more information about how to complete the assignment later in this lesson.
Materials and Equipment
- calculator
- 1-cm Grid Paper or 2-cm Grid Paper
- ruler or straightedge