Lesson 2
1. Lesson 2
1.5. Explore 2
Module 6: Proportional Reasoning
The fuel efficiency of vehicles is an important consideration when deciding which vehicle to take on a long trip. For instance, when moving, a person may use the vehicle’s fuel consumption rating to determine whether it is cheaper to drive the vehicle or to ship the vehicle to the new location.
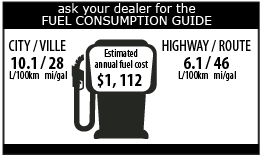
A vehicle’s fuel consumption rating, or fuel efficiency, is represented as a rate. Fuel consumption ratings are given as L/100 km or mi/gal (miles per gallon). A vehicle has two fuel consumption ratings: one for city driving, which includes a lot of stop and go, and one for highway driving. In Canada, all new light-duty vehicles have a standardized EnerGuide Label that highlights the manufacturer’s approved fuel-consumption ratings for the vehicle. The label shows the city and highway fuel-consumption ratings as well as the estimated annual fuel cost for the vehicle.
 |
Did You Know? Natural Resources Canada has a fuel-consumption ratings tool that lets you compare the fuel efficiency of different makes and models of vehicles available in Canada. For more information, or to use the tool, type the words “NRC Fuel Consumption Ratings” into an Internet search engine. |
Try This 3

Comstock/Thinkstock
Rajesh and Kunal’s parents have a four-door car and a minivan. They are trying to determine which vehicle to take on their move and which vehicle to ship. The drive to the new city is 2400 km of mostly highway driving. It will cost about $2000 to ship either of the vehicles to their new city. Use the Gas Used Versus Distance Driven graph to answer the following questions.
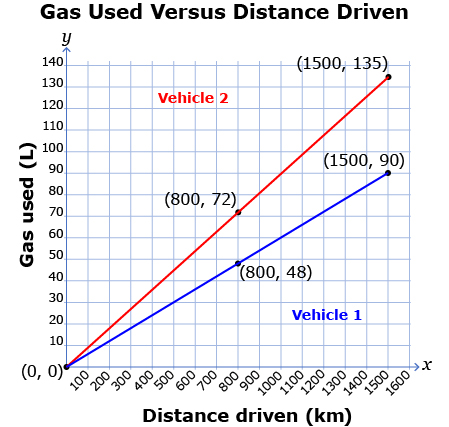
- Determine the slope of each graph. Include units in your answer.
- What does the slope of each graph represent?
- Vehicle 1 has a fuel-tank capacity of 70 L. How many kilometres can Vehicle 1 go on one tank of gas?

- Vehicle 2 has a fuel-tank capacity of 76 L. How many kilometres can Vehicle 2 go on one tank of gas?
- Which line on the graph represents the car? Which line on the graph represents the minivan? Justify your decision.
- Based on your results, which vehicle should the family drive to their new city? Which vehicle should they put on the moving truck? Justify your answer.
- What other factors would you need to consider, besides fuel efficiency, when deciding which vehicle to drive and which vehicle to ship?
Share 1
Compare your responses from Try This 3 with another student or appropriate partner. Explain your reasoning for the vehicle you suggested the family drive on their move and the vehicle that should be shipped.