Lesson 2
1. Lesson 2
1.8. Lesson 2 Summary
Module 6: Proportional Reasoning
Lesson 2 Summary
As the demand for more environmentally friendly vehicles increases, the demand for more fuel-efficient vehicles also increases. Fuel consumption or fuel efficiency is expressed as a rate—usually in litres per 100 km or miles per gallon. Graphs can be used to represent and compare the fuel efficiency of different vehicles.
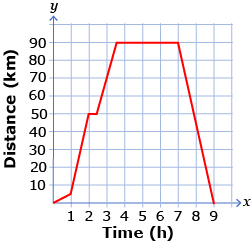
Graphs that show the relationship between two quantities have a slope that represents the average rate of change for those quantities. The slope of a graph that represents a rate of change is a unit rate. For example, on a distance-time graph, the slope represents the speed of the object. Speed, when expressed as m/s or km/h, is a unit rate.
Graphs are another strategy that can be used to represent and compare rates. In Lesson 3 you will use graphs and other strategies to analyze and solve problems that involve rates.