Lesson 2
1. Lesson 2
1.4. Discover
Module 4: Polynomials
Discover
Comstock/Thinkstock
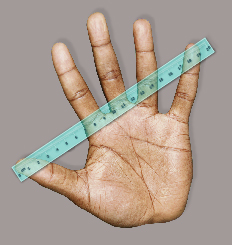
Read “Investigate the Math,” up to question A, on page 295 of your textbook. Notice how the relationship between variables can be used to make predictions.
In the textbook, you read that Nathan wants to know if a person’s hand span is based on his or her height. To test this relationship, he recorded the heights and hand spans, both in centimetres, of 15 classmates.
Then he created the following scatter plot.
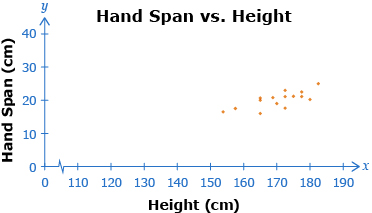
Data Source: PRINCIPLES OF MATHEMATICS 12 by Canavan-McGrath et al. Copyright Nelson Education Ltd. Reprinted with permission.
Try This 1
Use the Hand-Height Tool to create a line of best fit that best approximates the data acquired by Nathan. The line of best fit should approximate the trend in the data.
Record the equation of your line. What is the domain and range of your equation for the line of best fit?
![]() Save your responses in your course folder.
Save your responses in your course folder.
Share 1
With a partner or in a group, discuss answers for the following questions.
- What are your equations of the line of best fit? If they are different, explain why.
- What is the meaning of domain and range in the context of this problem? How do they relate to the domain and range you stated in Try This 1?
- How can a line of best fit be used to determine hand spans for people 140 cm and 160 cm tall?
![]() If required, place a summary of your discussion in your course folder.
If required, place a summary of your discussion in your course folder.