Lesson 2
Completion requirements
Created by IMSreader
1. Lesson 2
1.8. Explore 4
Module 4: Polynomials
In Try This 3, you used lines of best fit to compare different sets of data. In that activity, you may have found that a linear regression was reasonable for both graphs because the data tended to follow a straight line. If the data does not follow a straight line, it is not reasonable to use a line of best fit or linear regression.
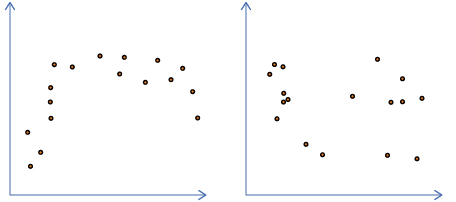
Neither a line of best fit nor a linear regression should be used with these sets of data because neither graph follows a straight-line pattern.
Self-Check 2
- Ahmed is planning a vacation. He would like to know how much money he would need for spending money. He asked his friends who have taken vacations how much they spent on their holidays. He then created a scatter plot of this data and found a line of best fit.
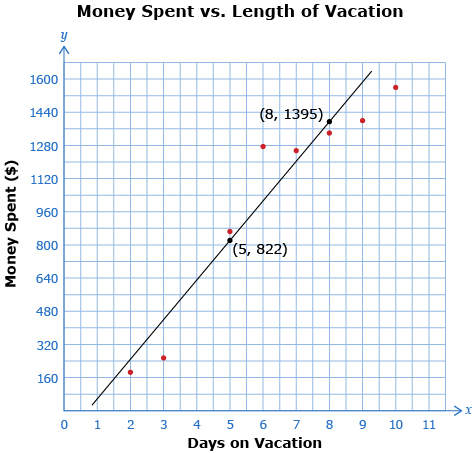
- Using the two points provided on the line of best fit, find the equation of the line in slope y-intercept form. Make sure to round the slope and the y-intercept to the nearest whole number. Answer
- State an appropriate domain and range for this problem. Answer
- Using your model (i.e., the equation of the line of best fit), how much could Ahmed expect to spend if he is on vacation for four days? Answer
- Using your model, if Ahmed has $1700 set aside, for how many days would he have spending money? Answer
![]()
- Complete questions 3, 5, and 6 on pages 301 and 302 of your textbook. Answer
Add the following terms to your copy of Glossary Terms:
- regression equation
- interpolation
- extrapolation