Lesson 7
Completion requirements
Created by IMSreader
1. Lesson 7
1.6. Explore 2
Module 7: Exponents and Logarithms
So far in this lesson, you have looked at exponential regressions. Next, you will focus on logarithmic regressions.
Try This 2

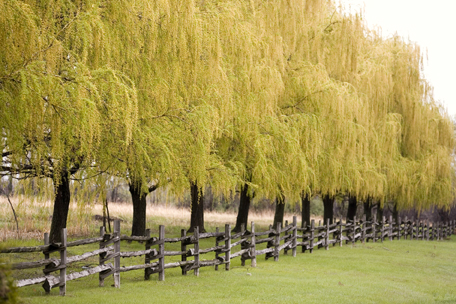
iStockphoto/Thinkstock
The Iverson family ordered some trees from the provincial shelterbelt program to plant on their acreage.
The following data shows the average growth rate of 20 weeping willow trees after planting. At the time of planting, all the trees were 2 ft in height and were 1 y old.
| Age of Trees (Years) |
Average Height (Feet) |
| 1 | 2 |
| 2 | 4.8 |
| 3 | 6.4 |
| 4 | 9.5 |
| 5 | 13 |
| 6 | 15.2 |
| 7 | 16.6 |
| 8 | 17.8 |
| 9 | 18.5 |
| 10 | 19 |
| 11 | 19.4 |
| 12 | 19.6 |
- Use your graphing calculator to plot the data.
- Is the average height increasing or decreasing?
- What is the shape of your scatter plot? What kind of model do you expect to use with this data?
- What is an appropriate domain and range in this situation?
![]() Save your responses in your course folder.
Save your responses in your course folder.