Lesson 7
1. Lesson 7
Module 7: Exponents and Logarithms
Lesson 7: Modelling Data Using Exponential and Logarithmic Regressions
Focus
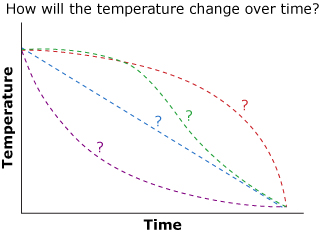
Imagine your favourite warm drink, perhaps tea or hot chocolate. The drink is nice and hot when it’s first made; however, the drink will cool off as it sits. Clearly the temperature is decreasing, but what would a graph of temperature versus time look like? Would it be a straight line? A curve? One way to determine what this graph looks like is to collect data and perform a regression.
In this lesson you will learn about exponential and logarithmic regression, and you will use those equations to model real-world problems.
Lesson Outcomes
At the end of this lesson, you will be able to
- use technology to determine exponential and logarithmic regression equations
- use a regression equation to answer questions in a real-world context
Lesson Question
You will investigate the following question: How can an exponential or logarithmic model be used to solve problems?
Assessment
Your assessment may be based on a combination of the following tasks:
- completion of the Lesson 7 Assignment (Download the Lesson 7 Assignment and save it in your course folder now.)
- course folder submissions from Try This activities
- additions to Glossary Terms
- work under Project Connection