Lesson 7
1. Lesson 7
1.7. Explore 3
Module 7: Exponents and Logarithms
iStockphoto/Thinkstock
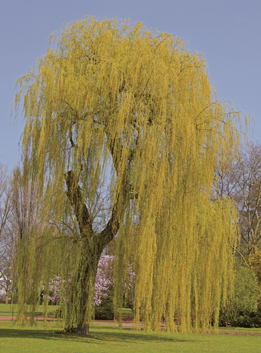
If you identified that the weeping willow tree growth looked like a logarithmic function, you are correct. The growth is also an increasing function, as the trees are getting taller as time passes.
Most graphing calculators provide the logarithmic regression equation in the form y = a + b ln x. The abbreviation ln is referring to loge and is usually called a natural logarithm. The number e is an irrational number, like π, and is approximately 2.718. Natural logarithms are important in advanced mathematics, so most regression programs use it instead of log10.
Determine a logarithmic regression equation for the data in Try This 2.
If you are unsure how to calculate a logarithmic regression, see your calculator manual or contact your teacher.
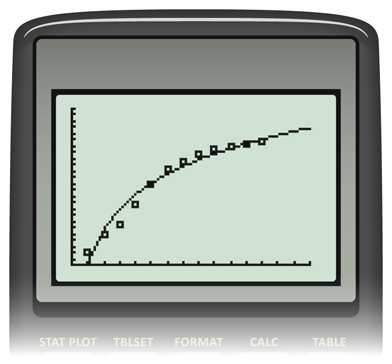
The logarithmic regression for the tree data is y = −0.068 + 8.136 (ln x). Make sure that you are able to do this on your calculator. Graph this function on the same grid as the scatter plot.
The screen on your graphing calculator should look similar to the following:
Self-Check 2
Using your logarithmic regression model from the weeping willow tree example, answer the following questions.
- Interpolate: What was the average height of the trees at 2.5 y of age (to the nearest tenth of a foot)? Answer
- Extrapolate: What is the predicted average height of the trees at 20 y of age (to the nearest tenth of a foot)? Is this prediction realistic? Answer
- According to your model, if the average height of the trees is 17 ft, what is the age of the trees to the nearest tenth of a year? Answer
- Complete question 8 on page 470 of your textbook. Answer