Module 4 Project
1. Module 4 Project
Module 4 Project
Graphic Design Using Polynomials
Project Overview
Purpose
In this project you will relate and explain the concepts from Module 4 to curve and contour designs.
Process
Towards the end of each lesson, under Project Connection, you may be prompted to complete a part of the Module 4 Project.
Make sure to save all work from each Project Connection in your course folder. You will submit your entire Module 4 Project to your teacher at the end of Module 4. Check with your teacher about how you should submit your project work before you begin the project.
Presentation
The most important part of your project presentation is clearly explaining and supporting your reasoning with relevant visuals and calculations. Make sure to show all work.
Review the Module 4 Project Rubric to ensure you understand the expectations for the project.
You can choose any format you prefer for the final presentation of this project. Some options include a written document, virtual or real poster, drawing, graphic art, website, video, oral report, or slide show presentation.
Project Introduction
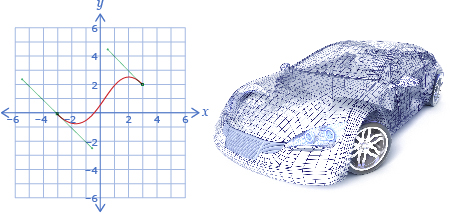
Graphic design is a creative process that combines art and technology to communicate ideas to a particular audience. Imagine the smooth curves of modern cars and the precision that must be involved in designing and creating these curves from metal or plastic materials.
Bezier curves were designed as a tool based on mathematical curves and are used in drawing programs. Bezier curves are useful in graphic design because they can be scaled indefinitely, allowing them to model smooth curves of any shape. The Bezier curve, in a simple form, is a cubic polynomial; however, more complicated forms are possible.
iStockphoto/Thinkstock
Pierre Bezier did not develop the curves, but he did patent their use for car manufacturing while working for the car manufacturing company Renault in the 1960s. The principles of these curves are used today in computer animations and 3-D graphics.
Part 1
guitar player: Jupiterimages/Photos.com/Thinkstock, sand dunes: Stockbyte/Thinkstock
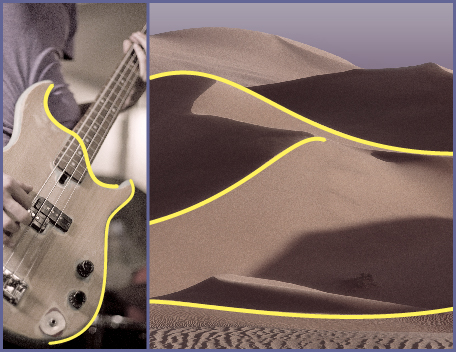
Polynomials are evident in many places in our environment—to find them, observe your surroundings with an awareness of graphs of polynomial functions. Such observations can often provide inspiration for graphic artists as they work on creative designs.
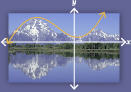
Step 1: Select a picture that clearly illustrates a polynomial function. Your picture might be a scene from nature (e.g., mountains, clouds, or lakes), a consumer product (e.g., cars, clothes, or furniture), or an abstract design. If the photo you choose is not your own, make sure the image is free of copyright restrictions.
Step 2: Clearly trace over the part of the picture that can be represented as a polynomial function.
Step 3: Draw x- and y-axes on the picture so that your curve crosses the x-axis at least twice.
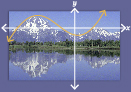
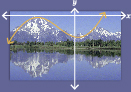
Correct and incorrect examples are shown.
Correct
|
Incorrect
|
Incorrect
|
altrendo nature/Stockbyte/Thinkstock
State the following characteristics of a polynomial function that could be used to create your curve. For each characteristic, give a mathematical justification.
- degree (odd or even)
- the sign of the leading coefficient
![]() Make sure to save your work in your course folder. Then return to Lesson 2.
Make sure to save your work in your course folder. Then return to Lesson 2.
Part 2
Activity 1
Select a second picture that clearly illustrates a quadratic function. Your photo might be a scene from nature (e.g., mountains, clouds, or lakes), a consumer product (e.g., cars, clothes, or furniture), or an abstract design. If you choose a photo that is not your own, make sure the image is free of copyright restrictions.
Clearly trace over the part of the picture that can be represented by a quadratic function. Make four copies of your photo.
Make sure to save your work in your course folder. Ensure your original picture is preserved in your course folder as you work through the activities.
Activity 2
- Use the new photo you selected for Part 2. Find a regression curve of best fit that produces a non-zero value for a and zero for each of b and c.
- Draw x- and y-axes on the picture, and put a scale on the axes. Clearly indicate a minimum of three points on your curve using the scale you made. You will need to experiment so that you place your axes in such a way to produce the wanted regression equation.
- State the quadratic regression equation. Round the value for a to the nearest hundredth.
![]() Make sure to save your work in your course folder.
Make sure to save your work in your course folder.
Activity 3
- Use a new copy of your photo. Find a regression curve of best fit that produces non-zero values for a and b and zero for c.
- Draw x- and y-axes on the picture, and put a scale on the axes. Clearly indicate a minimum of three points on your curve using the scale you made. You will need to experiment so that you place your axes in such a way to produce the wanted regression equation.
- State the regression equation. Round the values for a and b to the nearest hundredth.
![]() Make sure to save your work in your course folder.
Make sure to save your work in your course folder.
Activity 4
- Use a new copy of your photo. Find a regression curve of best fit that produces non-zero values for a and c and zero for b.
- Draw x- and y-axes on the picture, and put a scale on the axes. Clearly indicate a minimum of three points on your curve using the scale you made. You will need to experiment so that you place your axes in such a way to produce the wanted regression equation.
- State the regression equation. Round the values for a and c to the nearest hundredth.
![]() Make sure to save your work in your course folder.
Make sure to save your work in your course folder.
Activity 5
- Use a new copy of your photo. Find a regression curve of best fit that produces non-zero values for a, b, and c.
- Draw x- and y-axes on the picture, and put a scale on the axes. Clearly indicate a minimum of three points on your curve using the scale you made. You will need to experiment so that you place your axes in such a way to produce the wanted regression equation.
- State the regression equation. Make sure to round the values for a, b, and c to the nearest hundredth.
![]() Make sure to save your work in your course folder. Then complete the Conclusion.
Make sure to save your work in your course folder. Then complete the Conclusion.
Conclusion
Write a brief conclusion to your Module 4 Project. Include a personal reflection of what you feel you learned from the project. Include comments on what you discovered about placing the axes in Part 2 to produce the various regression equations. Explain clearly.
Project Assessment
Your Module 4 Project will be evaluated by your teacher using the evaluation guidelines in the project rubric. Read the rubric carefully. Make sure you are aware how you will be assessed. You can print or save a digital copy of the Module 4 Project Rubric as a guide to help you complete your project.
Don’t forget to submit your completed Module 4 Project to your teacher at the end of Module 4.