Lesson 1
1. Lesson 1
1.3. Refresher
Module 4: Polynomials
Refresher
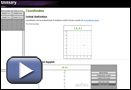
To be successful in creating graphs of functions, you need to know how to plot coordinates. If you feel you need a review of this, go to the Coordinates applet.
Instructions for use: Grab the point in the demonstration applet, and observe how the coordinates change as you move the point around. You may want to choose “show indicator lines” to remind yourself how the coordinates are determined.
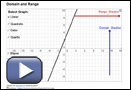
For a review of domain and range, use the Domain and Range Compressor applet.
Instructions for use:
- Choose one of the graph types.
- To see the corresponding domain, drag the Domain Shadow slider all the way to the bottom. The corresponding domain shadow (i.e., the blue line along the x-axis) represents the domain of the function.
- To determine the corresponding range, drag the Range Shadow slider all the way to the left. The corresponding range shadow (i.e., the red line along the y-axis) represents the range of the function.
Screenshot reprinted with permission of ExploreLearning
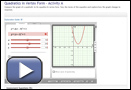
Use the “Quadratics in Vertex Form—Activity A” gizmo to explore and investigate quadratic functions in f(x) = a(x − h)2 + k form. Click on the “Exploration Guide” and follow the directions to get the full use of this interactive multimedia piece.
Go back to the Are You Ready? section and try the questions again. If you are still having difficulty, contact your teacher.