Lesson 1
1. Lesson 1
Module 4: Polynomials
Lesson 1: Polynomial Functions and Their Graphs
Focus
Comstock/Thinkstock
Mathematical models can be useful for making predictions. Consider the following scenario:
The treasurer of a drama club is putting together a budget for the club’s next production. She has determined the revenue the club can expect to generate for its next production as a function of ticket price. She has also determined the cost of the production, also as a function of ticket price. The following graph shows her predictions.
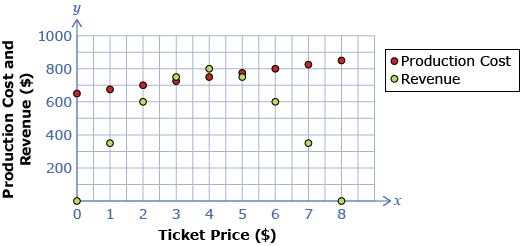
Data Source: PRINCIPLES OF MATHEMATICS 12 by Canavan-McGrath et al. Copyright Nelson Education Ltd. Reprinted with permission.
How could the treasurer determine the ticket price that would produce revenue greater than costs? One way would involve determining the equation of a function passing through the production cost data points and the equation of another function passing through the revenue data points.
In this lesson you will learn about different classes of polynomial functions—their characteristic shapes and algebraic forms.
Lesson Outcomes
At the end of this lesson, you will be able to
- sketch graphs that represent constant, linear, quadratic, and cubic functions
- relate characteristics of graphs of polynomial functions to the functions’ algebraic forms
Lesson Questions
You will investigate the following questions:
- How are the characteristics of the graph of a polynomial function related to the degree of the polynomial?
- How are the characteristics of the graph of a polynomial function related to the leading coefficient and constant term?
Assessment
Your assessment may be based on a combination of the following tasks:
- completion of the Lesson 1 Assignment (Download the Lesson 1 Assignment and save it in your course folder now.)
- course folder submissions from Try This and Share activities
- additions to Glossary Terms
- work under Project Connection
Self-Check activities are for your own use. You can compare your answers to suggested answers to see if you are on track. If you are having difficulty with concepts or calculations, contact your teacher.
Remember that these questions and activities provide you with the practice and feedback that you need to successfully complete this course. You should complete all the questions and place the answers in your course folder. Your teacher may wish to view the work to check on your progress and to see if you need help.
Time
Each lesson in Mathematics 30-2 EveryWare is designed to be completed in approximately two hours. You may find that you require more or less time to complete individual lessons. It is important that you progress at your own pace, based on your individual learning requirements.
This time estimation does not include time required to complete Going Beyond activities or the Module Project.