Lesson 1
1. Lesson 1
1.4. Discover
Module 4: Polynomials
Discover
The drama club scenario presented in the Focus requires that you recognize shapes of scatter plots and relate them to polynomial functions. The following activity will help you recognize the shapes for constant, linear, quadratic, and cubic polynomial functions.
Try This 1
Open Polynomial Data Fitter. Your goal is to drag the blue points to make the line or the curve match the red points. If you can’t make the line or the curve match the red points, click one of the buttons (“Constant,” “Linear,” “Quadratic,” or “Cubic”) and try moving the blue points again.
Once you have matched the first set of red points, move the “Data Set” slider to select another set of red points to match.
Try This 1 gave you experience with the shapes of the graphs of constant, linear, quadratic, and cubic functions. You also saw the different equations for the graphs you were manipulating.
Share 1
With a partner or in a group, come to agreement on the typical shape, highest exponent, and sample equation for each type of function. You may want to organize your results in a table similar to the following. The entries for linear functions have been filled in for you.
Type of Function |
Highest Exponent |
Example Equation |
Example Shape |
Constant |
|
|
|
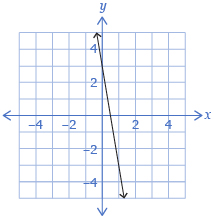
Linear |
1 |
f(x) = −5x + 3 |
|
Quadratic |
|
|
|
Cubic |
|
|
|
![]() If required, save a record of your discussion in your course folder.
If required, save a record of your discussion in your course folder.