Lesson 1
1. Lesson 1
1.5. Explore
Module 4: Polynomials
Explore
The shapes of the functions you experimented with in the Discover section are summarized in the following table.
Type of Function |
Highest Exponent |
Example Equation |
Example Shape |
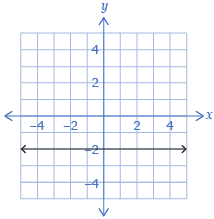
Constant |
0 |
f(x) = −2 |
|
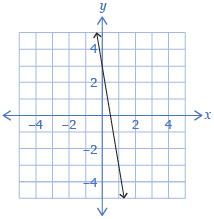
Linear |
1 |
f(x) = −5x + 3 |
|
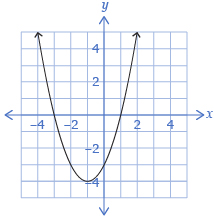
Quadratic |
2 |
f(x) = x2 + 2x − 3 |
|
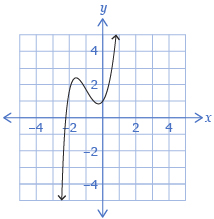
Cubic |
3 |
f(x) = 2x3 + 5x2 + 2x + 1 |
|
The functions you graphed in the Discover are all examples of polynomial functions.
A polynomial function contains only the operations of multiplication and addition with real numbers and variables. For example,
f(x) = 5x3 + 6x2 − 3x + 7
The function can also be written as
f(x) = 5(x)(x)(x) + 6(x)(x) + (−3)x + 7
From PRINCIPLES OF MATHEMATICS 12 by Canavan-McGrath et al. Copyright Nelson Education Ltd. Reprinted with permission.
In Discover you specified the highest exponent (on a variable). This is called the degree of the polynomial. In this module you will work with degree 0, 1, 2, and 3 polynomial functions.
Degree |
Name |
Example |
0 |
constant |
f(x) = 3.5 |
1 |
linear |
f(x) = 4x − 1 |
2 |
quadratic |
f(x) = 3x2 + 6x − 1 |
3 |
cubic |
f(x) = 5x3 − 4x2 + 7x + 3 |
Try This 1 introduced you to the general shapes and characteristics of polynomial functions. When describing a graph, it is often useful to consider the following characteristics:
- x-intercepts
- y-intercepts
- end behaviour
- domain
- range
- turning points
Most of these characteristics should be familiar to you; however, end behavior and turning points may be new.
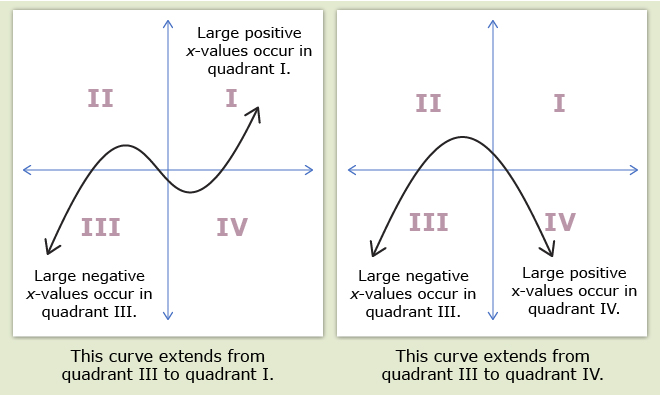
The end behaviour of a graph describes what happens as the x-values become very large positive or very large negative numbers. In this course, you will typically describe end behaviour by stating the quadrant the graph is in for large negative x-values and large postive x-values.
A turning point occurs when a graph changes from increasing to decreasing or from decreasing to increasing.
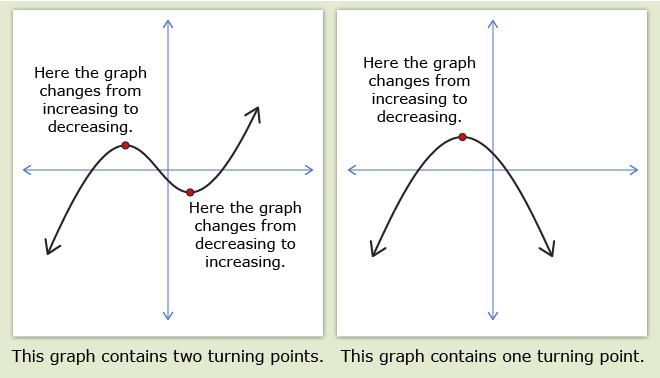
In the definition for turning point, describing a function that is decreasing means the curve is falling from left to right. Describing a function that is increasing means the curve is rising from left to right.