Lesson 1
1. Lesson 1
1.8. Explore 4
Module 4: Polynomials
In the first part of this lesson, you related the degree of polynomial functions to the shapes of the corresponding graphs. In the next part of this lesson, you will investigate the specific components of the equations that affect the corresponding graphs.
Try This 3
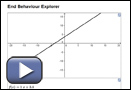
Use the End Behaviour Explorer to look for patterns in end behaviour and the y-intercepts. When the applet starts, a first degree (linear) function is shown. Change the “a” and “b” sliders, and pay attention to how the
- end behaviour of the function changes
- y-intercept changes (Be sure to check the “Show y-intercept” box.)
Repeat for degree 0, 2, and 3 polynomial functions.
- Which slider(s) affect the end behaviour of the graphs? Does the sign of this slider affect the end behaviour?
-
- Which slider(s) affect the y-intercept of the graphs?
- Record your observations in a table like the following.
Degree
Type of Function
End Behaviour
Starting Quadrant
Ending Quadrant
0
constant
1
linear
2
quadratic
3
cubic
![]() Save your responses in your course folder.
Save your responses in your course folder.
Share 2
With a partner or in a group, share your end behaviour observations from Try This 3. Once you come to agreement on end behaviour, discuss the following questions.
- Which parts of the polynomial can be used to predict end behaviour?
- Which parts of the polynomial can be used to predict the y-intercept?
![]() If required, place a summary of your discussion in your course folder.
If required, place a summary of your discussion in your course folder.