Lesson 3
Completion requirements
Created by IMSreader
1. Lesson 3
1.7. Explore 3
Module 4: Polynomials
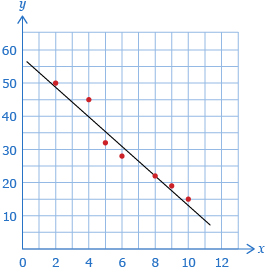
In Try This 2, you should have discovered that the data in part a. was linear. You may have noticed that as the x-values increased, the y-values decreased.
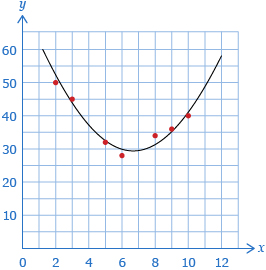
For part b., you should have found that the data was quadratic. You may have been able to predict this by noticing that as the x-values increased, the y-values decreased initially and then increased in the later data. This created a parabolic shape.
Data can model other patterns as well. The last type of regression you will study in this module is the cubic regression. (There are other forms of regression, some of which you will see in other modules.)